What this tool does
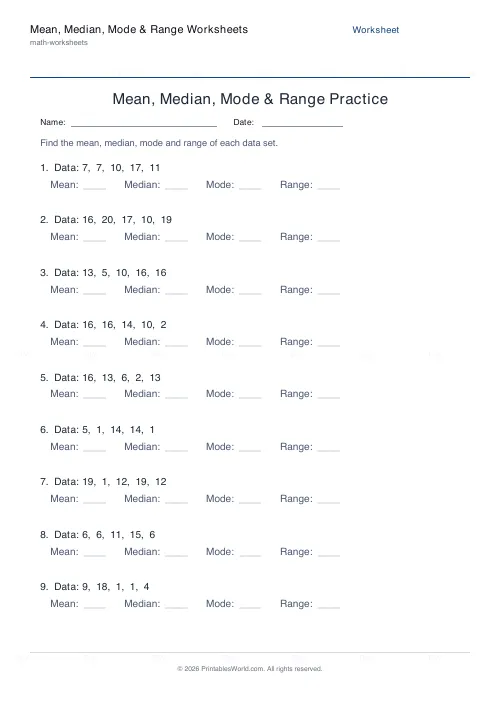
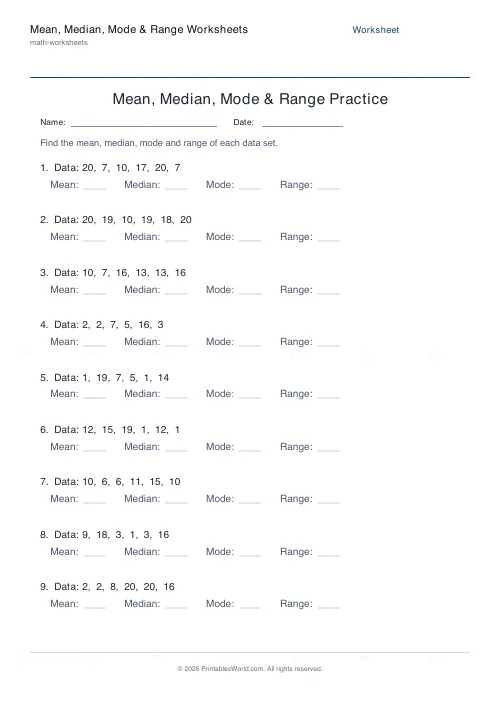
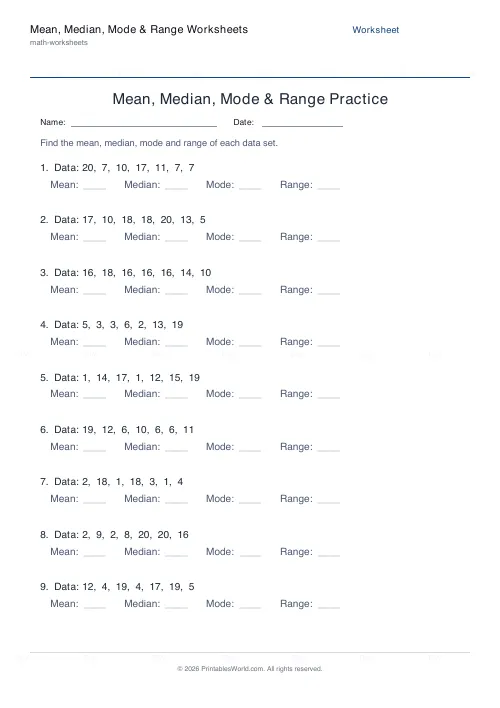
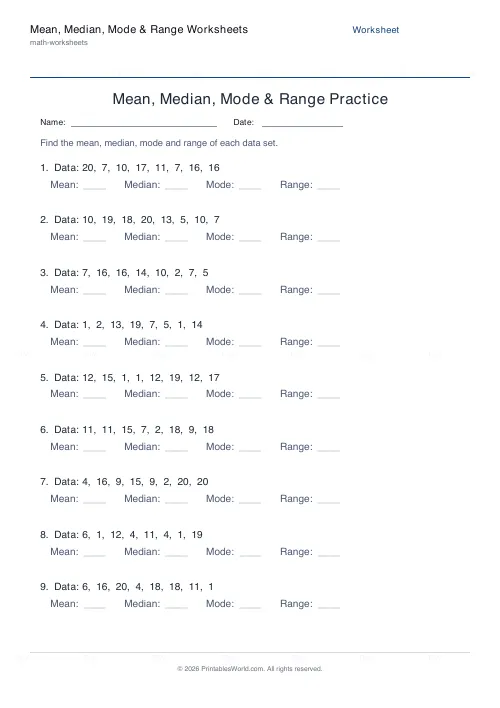
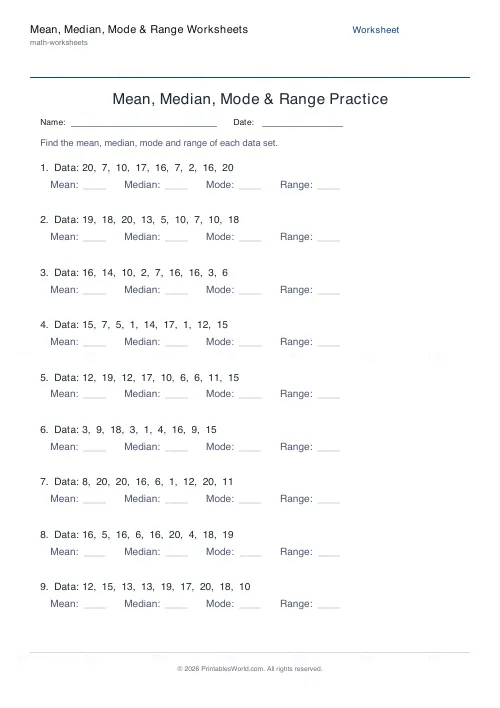
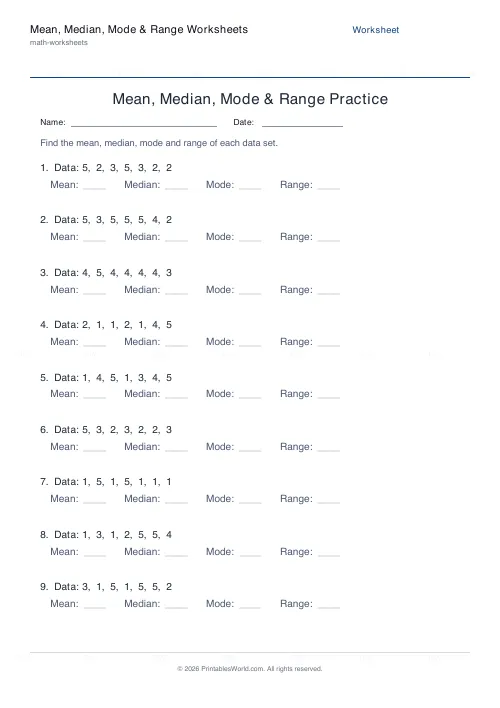
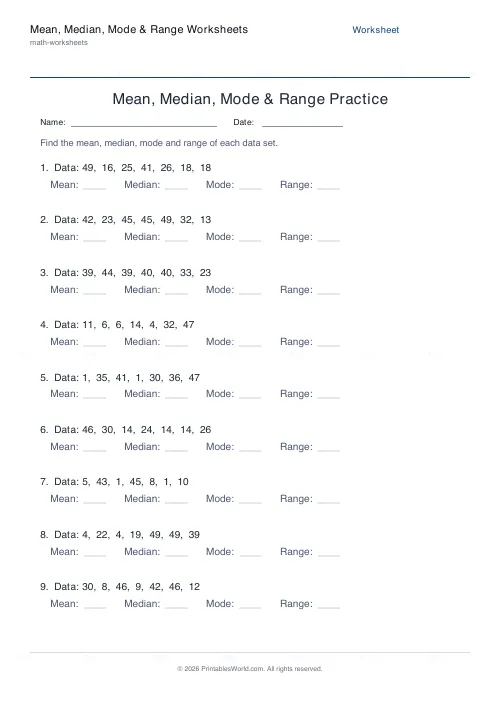
Generate printable mean, median, mode and range worksheets. Each problem gives a data set and asks for all four measures. Choose the set size and value range, with a full answer key.
People also used
Feedback
Spotted something off with this tool?
Practise the four averages
Mean, median, mode and range are the core measures of data covered across KS2 and KS3 statistics. This generator builds worksheets where each problem gives a list of numbers and asks for all four. Every data set is built to contain a repeated value so the mode is always well-defined, and a full answer key is generated for quick marking.
The four measures
- Mean: add all the values and divide by how many there are.
- Median: the middle value when the data is put in order.
- Mode: the value that appears most often.
- Range: the largest value minus the smallest.
What is adjustable
- Set size: how many numbers in each data set (5–9).
- Value range: the largest number that can appear.
- Problems per sheet: a quick set or a full page.
- Answer key, Name & Date: for marking and classroom use.
How to run it
- Set the data-set size and the maximum value.
- Choose how many problems you want.
- Toggle the answer key and Name/Date fields.
- Preview, press Generate New for a fresh set, then download or print.
Teaching ideas
Remind pupils to put the data in order before finding the median. It is the most common slip. Odd-sized sets give a single middle value, which is easier to start with. Discuss why the mean can be a decimal while the mode and range are always whole numbers here.
Which average to use, and when
Children learn to calculate all four and are rarely told when each is the right choice. That is the part worth teaching, because it is what the measures are for.
- Mean — the standard "average". Uses every value, so it is the most informative and the most easily distorted by one extreme value.
- Median — the middle value. Barely affected by extremes, which is why house prices and salaries are usually reported as medians.
- Mode — the most common value. The only one that works on data that is not numbers at all: favourite colour has a mode and no mean.
- Range — not an average. It measures spread, not centre, and answering "what is the average?" with the range is a common slip.
A question worth asking on every data set: if the largest value doubled, which of the four would change? Working that through does more for understanding than another page of calculations.
The mistakes that cost marks
Forgetting to sort before finding the median. By far the most common error. The middle value of an unsorted list is meaningless, and the sorting step is invisible in the answer, so it is easy to skip.
The median of an even-sized set. With eight values there is no single middle, so you take the mean of the middle two. Children frequently pick one of them instead.
Assuming there is exactly one mode. A set can have two modes, several, or none at all if every value appears once. "No mode" is a legitimate answer.
Dividing by the wrong count. For the mean, divide by how many values there are, not by the largest value or the number of different values.
A worked example
Take the set 4, 8, 6, 4, 13.
- Sort it first: 4, 4, 6, 8, 13. Do this before anything else.
- Mean: 4+4+6+8+13 = 35, divided by 5 values = 7.
- Median: five values, so the third is the middle = 6.
- Mode: 4 appears twice, everything else once = 4.
- Range: 13 − 4 = 9.
Worth noticing: the mean (7) is higher than the median (6), pulled up by the single 13. That is exactly the distortion the median exists to avoid, and pointing it out on a set this small makes the idea concrete.
Using data the class collected
These measures mean more on real numbers than on a printed list. Data that takes two minutes to gather: heights in centimetres, shoe sizes, how many siblings, minutes spent travelling to school, letters in each first name.
Shoe size is a good first data set because the mode is genuinely useful (a shop would want it), the mean often lands on a size that does not exist, and that oddity prompts a real discussion about which average is appropriate.
Names are useful too: the mean number of letters is a decimal, which surprises children and reinforces that an average need not be a possible individual value.
FAQs
Quick answers
What is the difference between mean, median and mode?
The mean is the total divided by the count; the median is the middle value in order; the mode is the most common value. They can all differ for the same data set.
Will every data set have a mode?
Yes. Each set is built with at least one repeated value, so there is always a clear mode to find.
Why is the mean sometimes a decimal?
Because the total may not divide exactly by the number of values. The answer key shows the mean rounded sensibly; the mode and range are always whole numbers.
Can I change how many numbers are in each set?
Yes. Choose a set size from 5 to 9. Odd sizes give a single middle value for the median; even sizes average the two middle values.
Related tools
Further reading
Math Worksheets
Understanding BODMAS and PEMDAS: order of operations explained
BODMAS and PEMDAS describe the same rule in different words. The trouble is that both hide two facts the acronym cannot express. Which is where nearly every mistake comes from.
5 min read
Math Worksheets
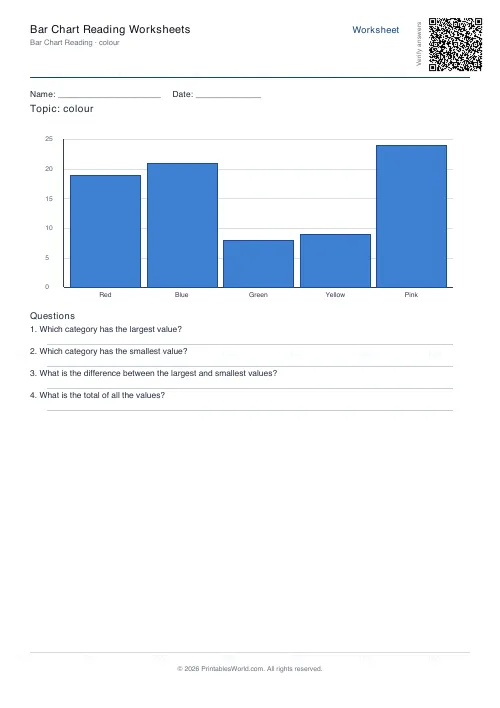
How to read and interpret bar charts with kids
Reading a bar chart is easy; interpreting one is not. Four questions turn a chart from something children decode into something they can reason about.
4 min read
More like this
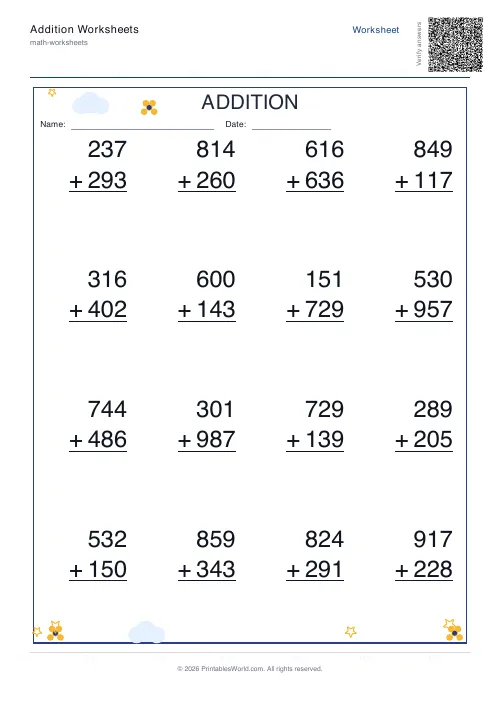 Addition Worksheets Generator
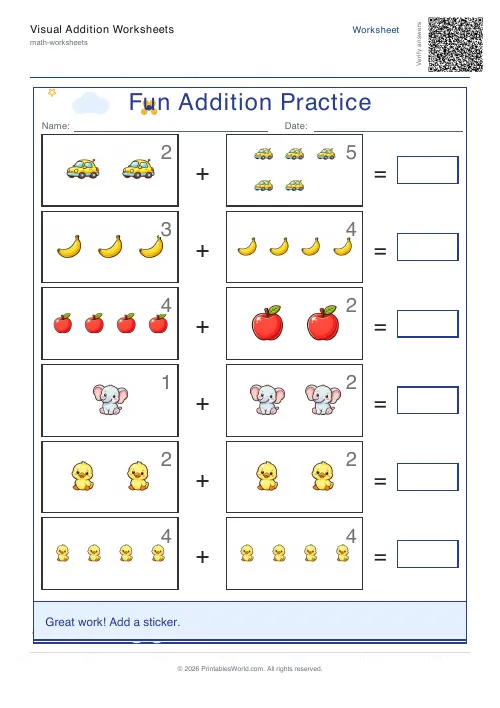 Visual Addition Worksheets Generator
 Subtraction Worksheets Generator
 Multiplication Table Generator
 Mixed Tables Generator
 Fractions Practice Sheets Generator
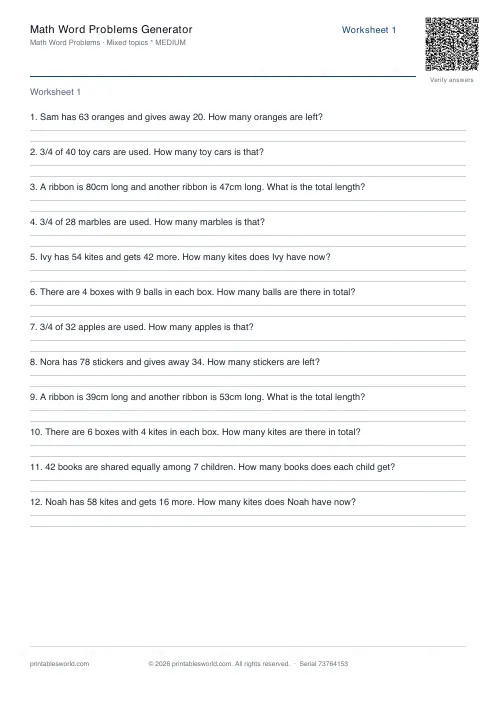 Math Word Problems Generator
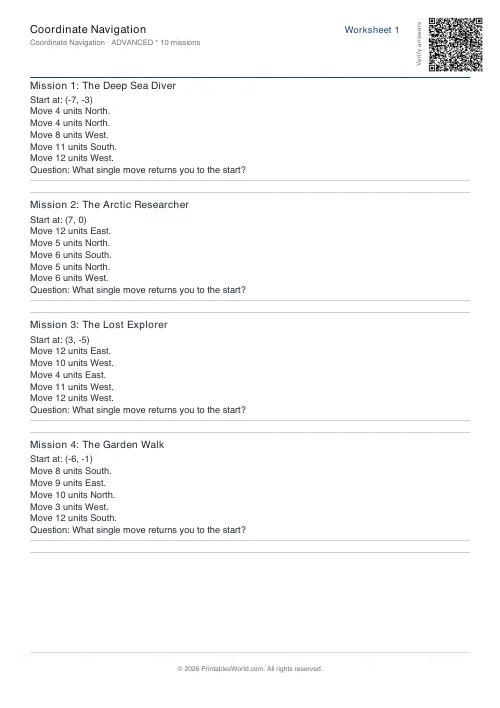 Coordinate Navigation Generator
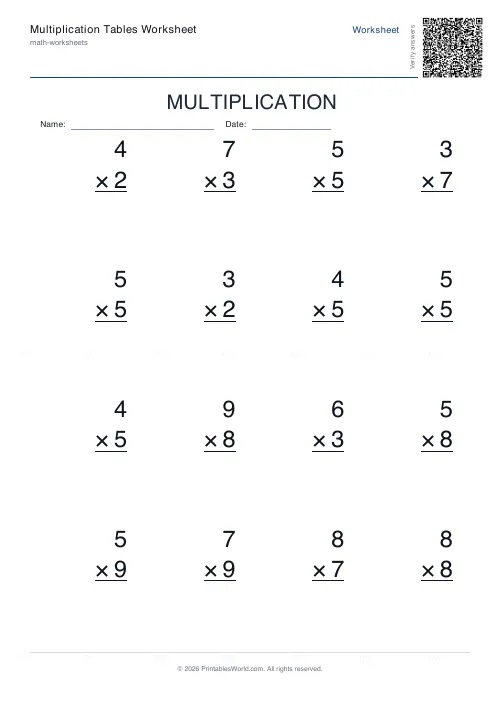 Multiplication Tables Worksheet
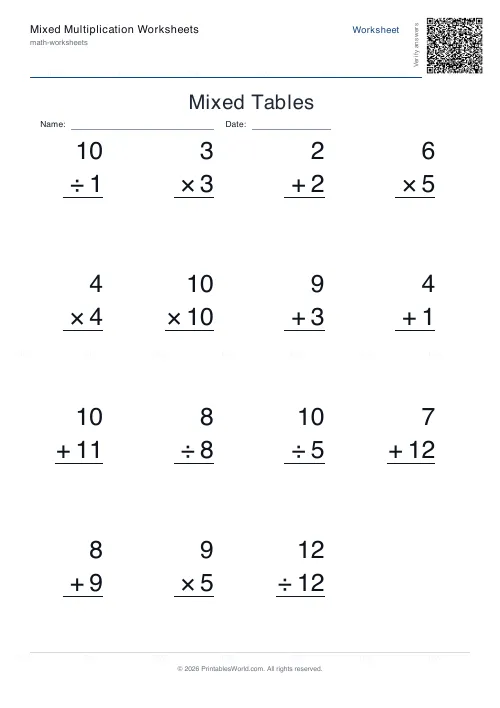 Mixed Multiplication Worksheets
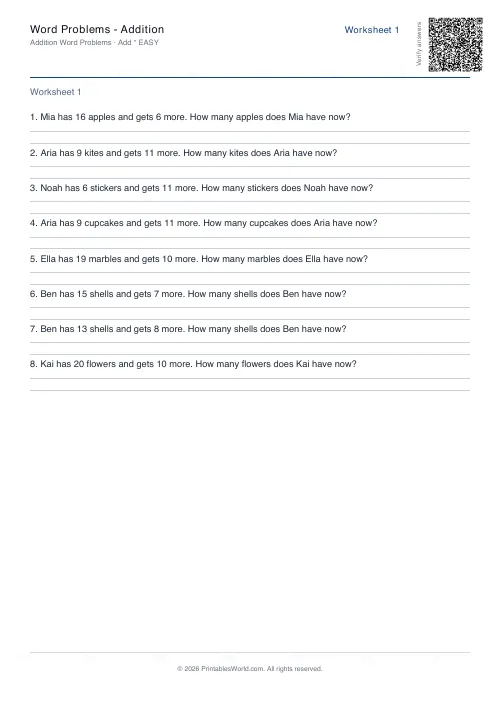 Word Problems: Addition
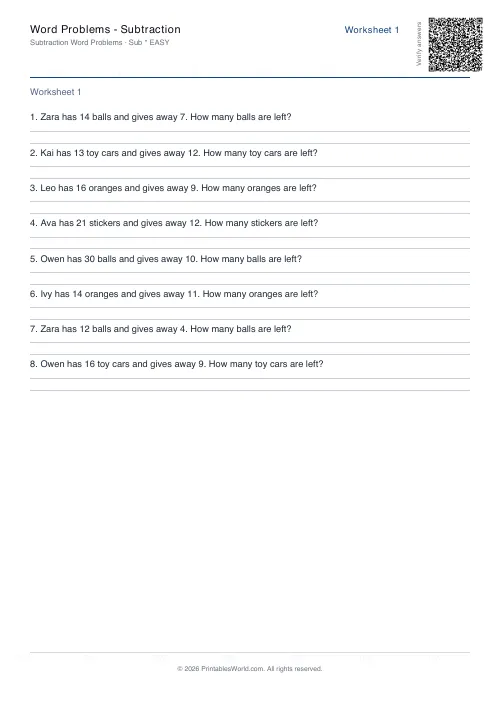 Word Problems: Subtraction
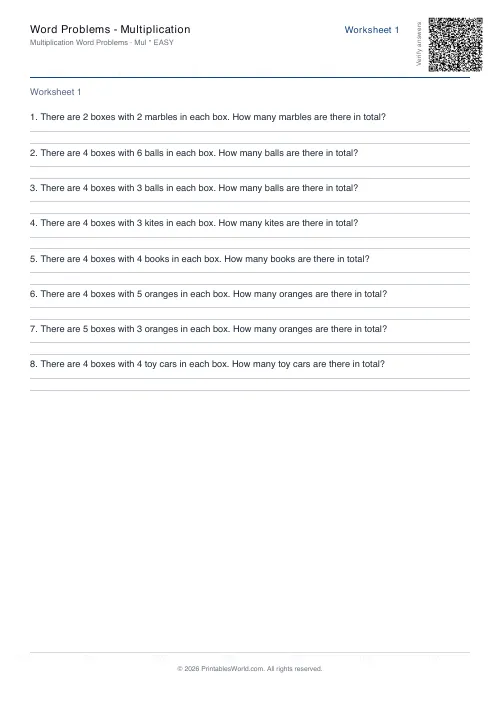 Word Problems: Multiplication
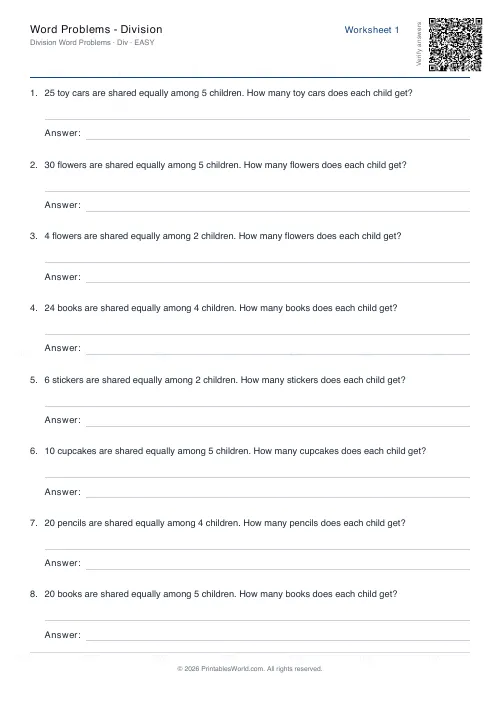 Word Problems: Division